VGStudio MAX

High-End Software for CT Data
VGStudio MAX is the high-end software from the Volume Graphics range of products for the visualization and analysis of CT data in combination with the optional add-on modules ‘Coordinate Measurement’, ‘Nominal/Actual Comparison’, Porosity/Inclusion Analysis’, ‘Wall Thickness Analysis’, ‘Fiber Composite Material Analysis’ and ‘CAD Import (with PMI)’, VGStudio MAX has become a virtual standard for industrial voxel data analysis.
VGStudio MAX provides unique functionality for precise and fast analysis of voxel data. The Coordinate Measurement Module, for example, provides a highly accurate local surface determination feature achieving measuring accuracies of up to 1/10th of the voxel size. It is only with this surface determination on the basis of voxels that a precise comparison of actual voxel data and nominal CAD data becomes possible.
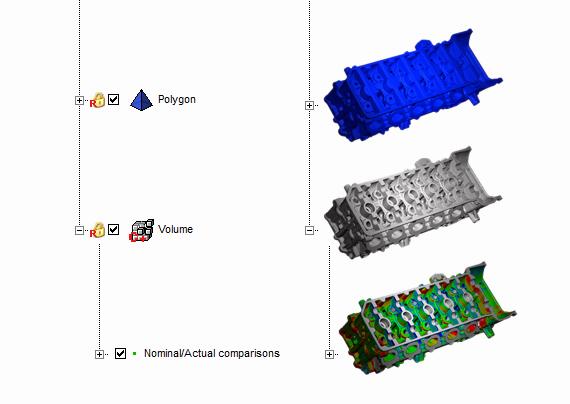
The unique possibility to simultaneously display and analyze volume and polygon data eliminates the need to perform a time-consuming and loss-prone conversion of volume data into surface data before a comparison can be made.
The possibility to process macros in batch mode and to create animations and surface models completes the functionalities of VGStudio MAX.
Visualization
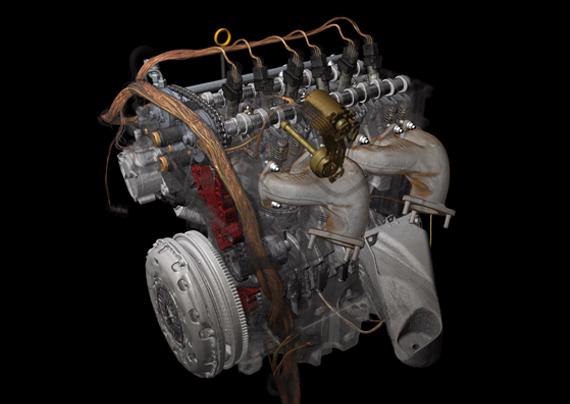
VGStudio MAX uses the scan data to create a three-dimensional model of the volume that can be displayed in 3D or in 2D slice images.
A range of different rendering methods are available for 3D representation: Ray tracing, Iso surface, MIP, X-ray and others. All renderers support stereo viewing: OpenGL stereo hardware, autostereoskopic or anaglyph images such as red/cyan images. Different types of light sources are also available and can be combined as required. Depending on the rendering method, realistic shadows can also be generated in the 3D view.
Thanks to the Multi-Planar Reconstruction (MPR) method used, the dataset can be scrolled through along any required axis.
Any number of volume data sets and CAD models of any size can be visualized at the same time, limited only by the capacity of the hardware used.
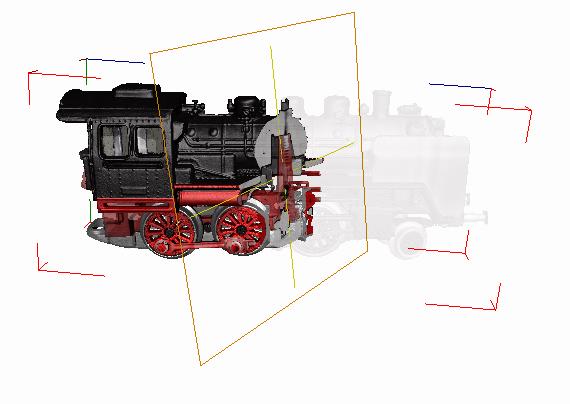
Clipping and positioning of objects
The term ‘clipping’ denotes the possibility to visually cut into a volume object in the 3D display area.
Clipping tools may be planes, boxes and spheres/ellipsoids, and clipped areas can be made completely transparent to hide them or semi-transparent.
Objects can be freely positioned and rotated within the 2D and 3D display areas using the mouse. Alternatively, it is also possible to achieve a precise position by entering the parameters numerically. This applies not only to the volume data and CAD models, but also to all other objects such as light sources and clipping tools.
Non-planar Viewing Mode
Starting with Version 2.2, 2D views are no longer limited to planar slices of the object. You can define shapes along which the 2D views will be generated. This allows you, e.g., to ‘unroll’ cylindrical objects, or to flatten a dented surface, and then scroll into the object following this shape.

Thick Slab Option
If you need to follow thin structures, such as wires, within your object, they will usually not be clearly visible within a single slice. A thick slab option combines consecutive slices into one 2D view. Thick slab can be applied to standard 2D slices as well as the new non-planar views. This allows you, e.g., to conveniently investigate a circuit even on a bent semiconductor chip

Segmentation and classification
Classification determines how volume data is displayed in 2D and 3D. During classification, an opacity value (3D) or a brightness value (2D) and a color is assigned to each voxel, depending on its ‘gray value’. Classification can be done in an interactive dialog.
Segmentation divides volume data into different sections. The various segments are also called ‘Regions of Interest’ (ROI). A range of tools is available for segmentation; they are either gray-value based (e.g. region growing) or based on geometry.
The software comes equipped with sub-voxel precise segmentation capabilities. Tools for a precise separation of individual components of a scanned assembly are available that are based on high accuracy image processing algorithms. Options for smoothing an ROI and/or fitting it to a local contrast allow applications like importing a CAD model with component structures using this as basis for an easy segmentation of a part.
Sub-voxel precise segmentation also helps generating even more precise analysis results, e.g., when measuring a contact surface area between two components or measuring the volume or surface of a component.
Once a ROI has been defined, analyses can be restricted to this area. In addition, ROIs can be used for the precise alignment of data sets.

Regions of Interest
Segmentation can be used to define a part of a volume data set as a ‘Region of Interest’ (ROI). Such an ROI may consist of one joint area or several unconnected areas. ROIs can be manipulated, for example, by creating intersections or combinations of several ROIs. ROIs are used for the purpose of separating a volume data set into individual parts and allow analyses to be restricted to specific areas of a data set. ROIs can also be used to achieve perfect alignment of data sets either with each other or with a CAD model.
All analysis modules of VGStudio MAX support the ROI concept to allow analyses to be performed with maximum performance and validity.

Data import/export
VGStudio MAX allows volume data to be imported in all commonly used formats. Any number of data sets may be loaded into the application at the same time, limited only by the hardware.
If an object has been scanned in sections, these may be assembled into one data set and exported as one.
VGStudio MAX includes a CAD kernel as standard feature of the base license. The CAD kernel allows the user to import CAD models including complex component structures as STEP or IGES files.The component structure can be used to segment a CT data set or to determine surfaces of multi-material/multi-component objects. The creation of coordinate measurement templates has been enhanced and accelerated by one-click CAD surface patches picking. As before, CAD models may also be imported in .STL format.
A convenient ‘pack&go’ feature is available which packs all project-relevant data, compressing them if required, for further use in analysis projects or for archiving of the data.

Object management
VGStudio MAX treats all elements such as volume data, surface models, ruled geometries, measuring templates, analyses and light sources as ‘objects’.
These objects are displayed in a hierarchical tree-like directory and can be grouped, copied, cut and inserted as required, making it easy, for example, to transfer measuring templates from one volume data set to another or to a CAD model or to apply it to another data set.
Global Tolerancing
VGStudio Max’s optional data analysis modules offer tolerancing capabilities, e.g., the Porosity/Inclusion Analysis Module allows you to define a maximum allowed pore size, a maximum allowed percentage of porosity, a minimum allowed pore’s distance to the objects surface, etc. In the same way different kind of tolerances can be defined within the Nominal/Actual Comparison Module, the Wall Thickness Analysis Module and the new Fiber Composite Material Analysis Module. You can thus see a ta glance whether a part is within the tolerances of the respective analysis that you have run on it.
Evaluations
Analyzing your object will often involve a variety of properties, such as porosity, GD&T, wall thickness and conformity with a CAD model. With the new evaluation options of VGStudio MAX, you can see at a glance whether your object evaluates to good or bad. You can define constraints for a single analysis, such as maximum diameter of a pore, and even combine them, e.g., to allow for larger pores if wall thickness doesn’t fall below a certain minimum. This new feature makes it possible to use CT for in-line inspection with fully automated good/bad classification.”
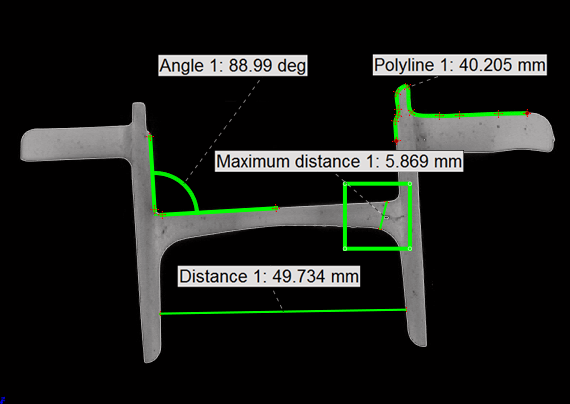
Data analysis and measuring functions
The VGStudio MAX basic software includes a range of useful analysis and measuring functions. There provide statistical information on volume data (average value, standard deviation, gray value histogram), volume content and surface area of objects or ROIs, but also information on the gray value and position of each individual voxel. Easy-to-use measuring instruments allow distances (actual or min/max), angles or polylines to be measured.
Extended analysis and measuring functionality is available with the optional add-on modules ‘Coordinate Measurement‘, ‘Nominal/Actual Comparison‘, ‘Porosity/Inclusion Analysis‘ and ‘Wall Thickness Analysis‘.
Animation
VGStudio MAX offers two tools to create spectacular animations/film sequences of your CT data: the Simple and the Classic Keyframer. Both approaches will help you to create stunning animations of your data with just a few clicks. These animations may contain any number of objects and include flights around the object or through the object while analysis results and measurements are faded in or out. Objects may be faded in or out, change color or transparency during the film sequence.
The 2D view may also be used to create film sequences scrolling through the image stack.
Depending on the operating system used, animations may be saved in various file formats for presentation or as image stacks for professional post-processing.

Filtering
VGStudio MAX provides numerous filters for volume data: linear and non-linear smoothing operators (Gauss, Median, adaptive Gauss), general separable convolution operator, gradient operator, morphological operators (erosion, dilation), point operator. All these filters can be applied directly to the voxel data in 3D.

Surface extraction
For tasks such as reverse engineering, many users need to create a surface model. VGStudio MAX is able to create such a model by extracting the surface from the volume data set. Surface models can be exported to STL and other formats. The advanced surface determination feature included in the optional Coordinate Measurement Module allows high-precision STL models to be created from voxel data since the surface is defined not on the basis of an overall threshold value but determined locally on the entire object surface.
Reporting
VGStudio MAX provides numerous features for the presentation of data and the documentation of results. It allows images to be copied into other applications or saved in standard image formats at any time and provides easy-to-use animation functions. Histograms and tabular data may also be exported in CSV or RTF format for post-processing in Word® or Excel®.
The optional add-on modules for extended analysis and measuring functionality also offer extensive user-definable reporting functionality allowing slice images of defects to be generated automatically.
All analysis results may later be visualized in myVGL but not repeated within the viewer software.
Download the brochure